Harvest is around the corner….but irrigation season is not quite done….
Topics:
- Growing Degree Day Update/Weather Update
- Current Corn Conditions….
- Prioritizing Harvest!
- Current Soybean Conditions….
As of September 5th, we have accumulated approximately the following for Growing Degree Units in 2022:
Planting Date GDU’s2021 Average GDU Departure from average
April 21 2698 2575 +123 (+6 days)
April 28 2632 2525 +105 (+5 days)
May 9 2569 2431 +138 (+7 days)
We have gained a little ground since the last update in mid-August. We are really a solid week ahead of the average. Current seven day forecast should net us another 120 GDUs.

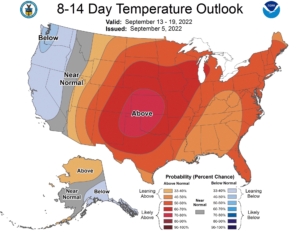
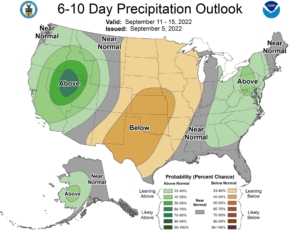
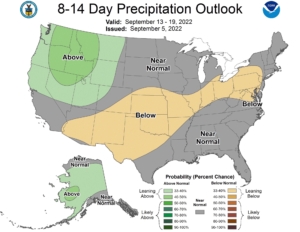
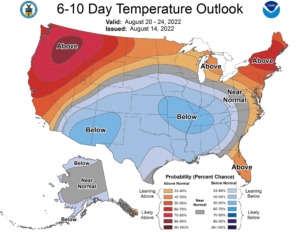
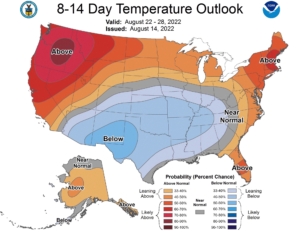
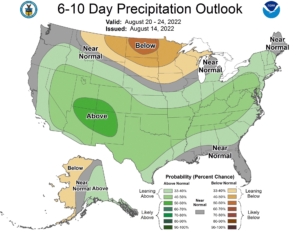
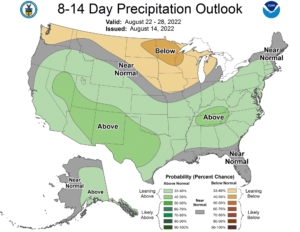
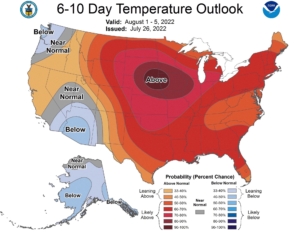
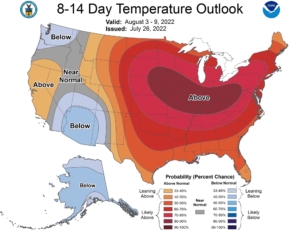
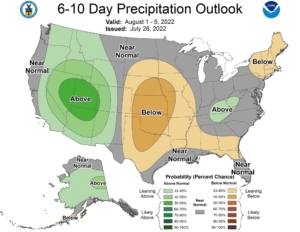
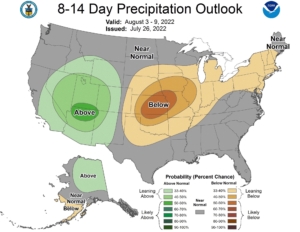
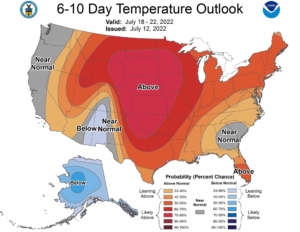
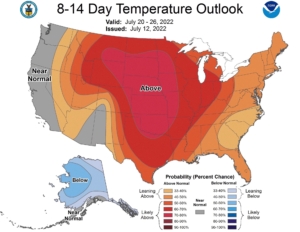
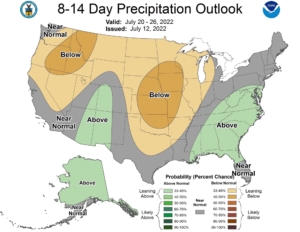
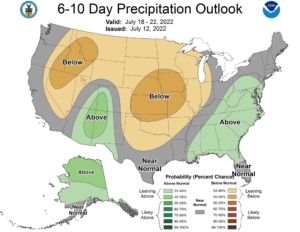
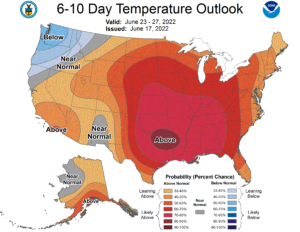
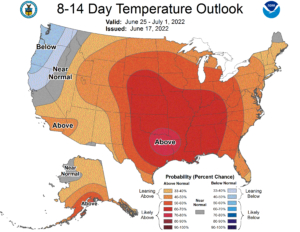
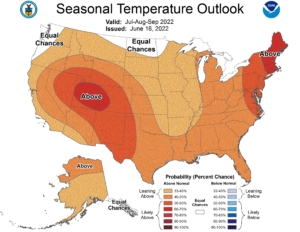
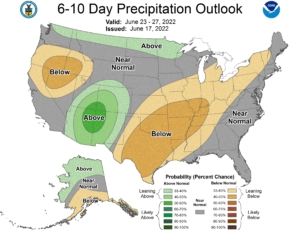
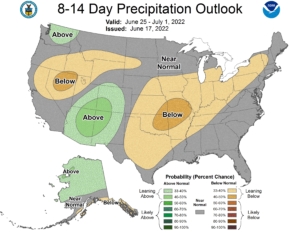
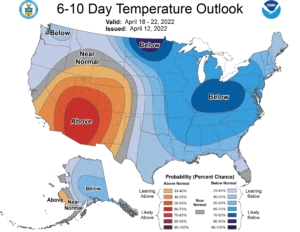
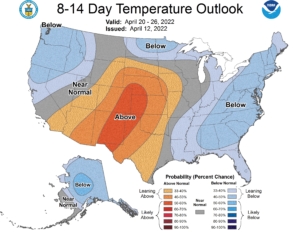
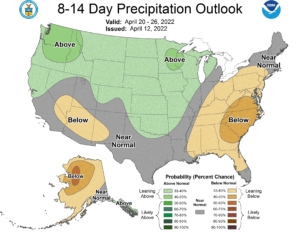
The above maps are temperature and precipitation forecasts for the next 6-10 and 8-14 days. As you can see, the pattern is very similar to what we have been experiencing all summer. The should move the crop along quickly….maybe too quickly in some cases….
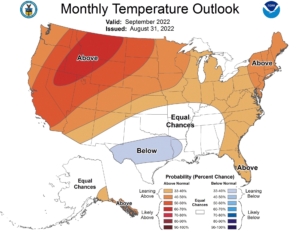
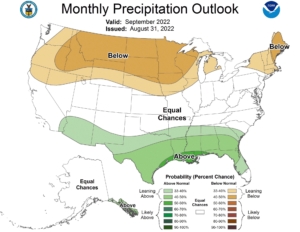
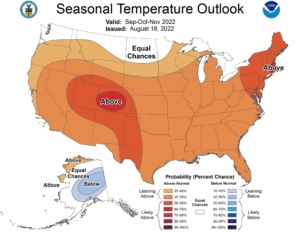

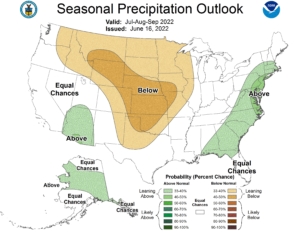
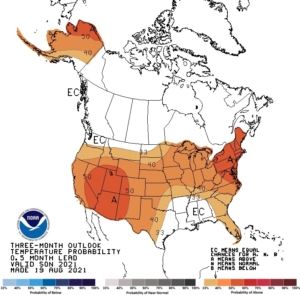
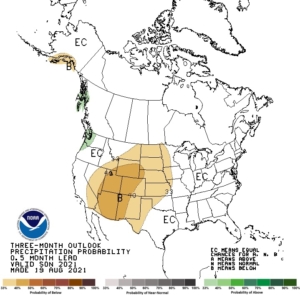
The above maps are the Monthly and Seasonal temperature and precipitation forecasts. If these forecasts hold true, harvest should begin in a timely fashion and should be an open one. However, not much to help out our dire precipitation needs. I also would not ‘hold-my-breath’ on these either….
Current Corn Conditions…..
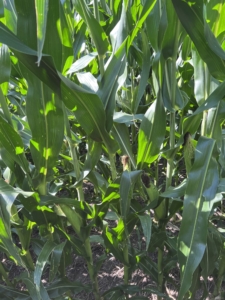
- Much of the corn crop is as follows: April planting dates – 103-110 day hybrids at 1/2-3/4 milk lines with 112-118 day hybrids at 1/4 to 2/3. May planting dates are 1/4 to 1/3 for the most part. Majority of crop is 1/3 to 2/3 milk line. Most fields will take another 7-14 days to finish, meaning we are still seeing an extended grain fill period even though we are further ahead than normal by the raw GDU numbers.
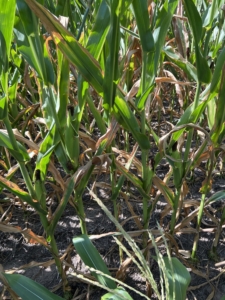
- Staygreen in the irrigated is holding up for now, but starting to see some ears droop on the irrigated, along with very late-season N deficiency, especially in the later-planted fields.
- Sunlight: We have been slightly (3-4%) above normal for sunlight over the last 45 days. Just for comparisons sake, this is less than what we had in 2012 by quite a ways. We are running ahead of 2021, however. Sunlight plays a huge role in grain yield (kernel size…test weight, etc.) and plant health. Having above normal sunlight is always a positive thing….
- On the flip side, 2022 has been as warm as 2012 for temperatures.
- Disease: Relative Humidity during the grain-fill period has been 8% below normal. 2012, by comparison, was 12%+ below normal during this time period. This has had a positive impact on overall disease outbreak. We are seeing very little for white mold versus past years, while most corn fields are clean yet. Just starting to see Gray Leaf Spot show up, which is very late.
- Currently we are looking at a good quality irrigated corn crop….kernel depth and grain color look very good overall at the present time.
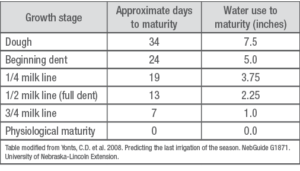
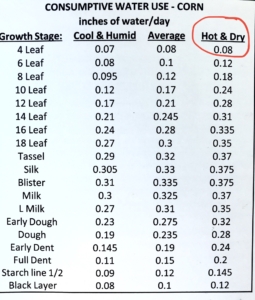
- Watering: The low RH has been a negative to ET rates over the grain-fill period…and really all year. Since January 1st total ET has been 45.03″. Contrast this to the normal of 29.88″ and one sees how dry we have been. Total ET rates over the last 45 days have averaged .05″/day above normal. Table below shows the approximate amount of water needed to reach maturity. Keep in mind that temperatures and Relative Humidity play a role in these amounts. Most all fields are still needing more water….
Prioritizing Harvest!
2022 crop has had its fair share of stress this year. As such, we could have a higher probability of more risk from stalk rots than we have experienced over the last few years. Stalk rots appear each year with varying degrees of severity. They are caused primarily by fungi and bacteria, but they can also result from environmental stresses (such as drought stress). When these diseases or conditions happen they weaken or destroy vascular tissue in the stalk, leading to the plant being unable to transport water or carbohydrates effectively, which ultimately results in premature plant death and reduced grain fill. With this being said, keep in mind dryland acres and corners as these will be some of the first to lodge or to drop ears from moisture stress….may want to harvest the corners ahead of time. Overall, the potential for increased severity of stalk rots is higher in 2022 than the previous few years from the combination of stresses experienced in 2022. Watch for those fields that lose staygreen quickly, or that have ears drop suddenly, as these are signs of premature death of the plant.
Current Soybean Conditions…..
- Soybeans are quickly turning in much of the area. Much of the crop is in the late-R6 stage of growth. It is possible that some irrigated acres could be ready to harvest in the next 10-14 days. Dryland corners are also turning fast now, keep these in mind for possible early harvest as well. The early-group II soybeans are moving along quickly now.
- Disease: Sudden Death Syndrome (SDS) continues to spread in the area. We see more of this disease year-over-year. This is a disease that can be controlled with ILeVo seed treatment. Sudden Death Syndrome in Soybeans
- Dectes Stem Borer.
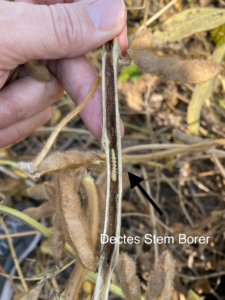 This insect enters the plant at a node and proceeds to ‘hollow out’ the stem leading to early plant death. So far not much one can do in the way of management for this insect yet. We saw a high incidence of this insect in our area last year. Expectations are that we will have the same or higher levels this year. Keep this in mind as harvest approaches….timely harvest will limit the economic impact of this insect.
 - For more info see the following link….Dectes Stem Borer in Soybeans
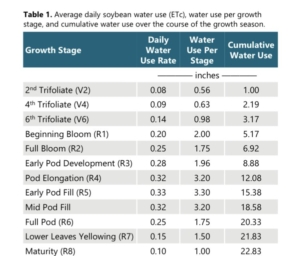
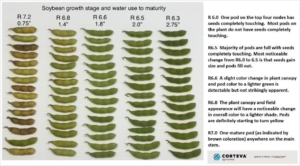
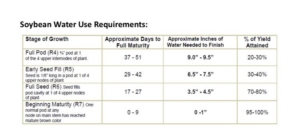
- The picture below shows the stage of growth for early R6 soybeans through R7. The chart below shows water needs to finish for soybeans. Most fields are in the R6.5 to R6.8 stage at present which still means 2-3″ of water to finish.
2022 Yield Data
Please check this website throughout harvest and this winter for local area yield data. We will continue to text yield results as they come out, but they will also get posted here for timely and organized viewing. The data will be under Ag Update – Harvest Data. Please contact us if you would like help calibrating your yield monitor and/or want a yield check!
Thanks for giving us the opportunity to be a part of your farming operation!
Starman Seed Service, Inc.
 Photos courtesy of Peter Starman
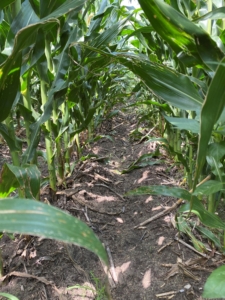
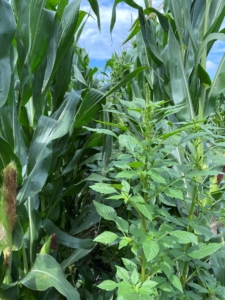
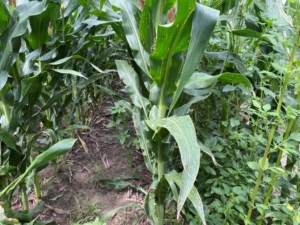
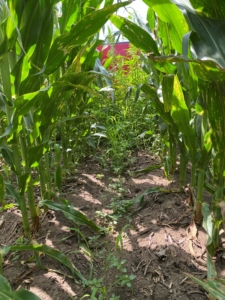
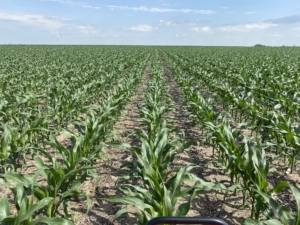
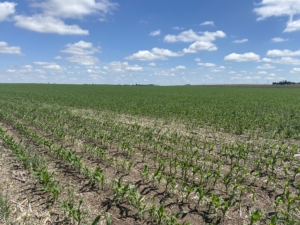
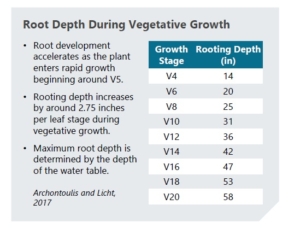 From the chart, you can see that average rooting depth for V6-V8 corn is approximately 20-25″, depending upon weather conditions, soil type and structure, etc. The AquaSpy moisture probes are showing 12-24″ rooting depths across soil types and planting dates, so we are very much in the normal on rooting depth. The video below presents where we are at on depth and crop water use.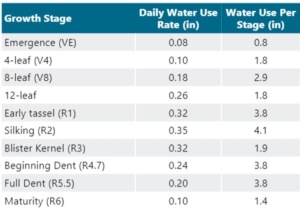
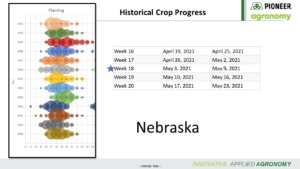 This is a chart showing the corn crop planting progress by years. The main thing to note here is the large circle at week 17 & 18. By week 18, over 70% of the corn crop was planted across the state, with more like 80% in our area. Last time we find that much corn planted that early was in 2021/2011 crop years. Having corn planted by the first week of May has proven to increase yields…did the early planting this year impact corn yields? Maybe so…. especially when we look at the rest of the growing season.
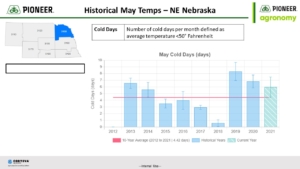 The above chart shows the number of cold days in May for NE Nebraska for the past ten years. Note that 2021 was above average for the number of days with average temperature below 50 degrees.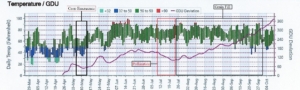
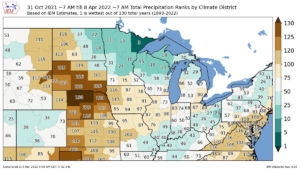
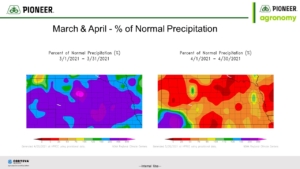 The above charts show the percentage of normal precip for March and April of this year. First note the abundant precip received in March; this was huge for dryland and limited irrigation fields. Second, not how dry April was overall. These conditions led to more ‘air pockets’ in some of the fields with less than optimum seed-to-soil contact leading to some uneven emergence. I also remember growers saying ‘how hard’ the soil conditions were at planting, especially when planting into May. May continued this downward trend of less than normal precipitation as we received only 60% of normal for May.
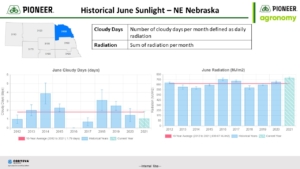 The above chart shows Cloudy Days and Sunlight for June. Two things to note here are the low number of cloudy days and the above average sunlight – in fact, the best sunlight for June in the past 10 years.
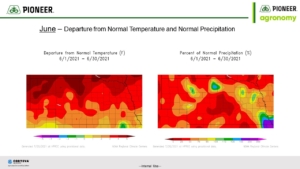 This chart shows the departure from normal temperature and normal precipitation for June. Note the above temps and slightly below normal precip for June. This, along with the above normal sunlight, led to optimal growing conditions, plants ‘stretched out’ with consequent higher ear placement. This was not the case for those fields planted in June itself. In these cases, plant height and ear height were below normal. This is where we began to run 7-10 days ahead of normal for GDU accumulation.
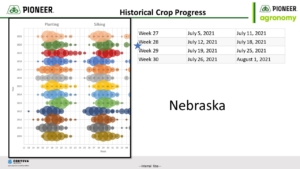 This chart shows the corn crop silking progress for Nebraska. Much like at planting, our silking dates were ‘bunched’ together, however, the crop silked later than expectations considering the heat in June…silking was more like normal time frame. However, there was some advantage I feel for those hybrids that silked early as they were not as impacted by the wind events, and they were better able to take advantage of the grain-fill weather.
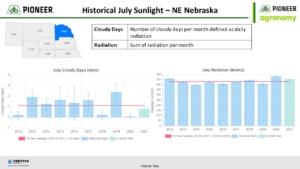 The above chart shows the cloudy days and sunlight for July. Just like in June, note the low number of cloudy days and slightly above normal sunlight, all conducive to yield….
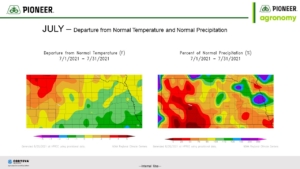 This chart shows the departure from normal temperature and normal precipitation for July. First thing to note is the slight reduction in temperatures for July. This led to a reduction in stress on the plant as well as delaying silking dates. Second, note the increase in precipitation in most of Antelope County…it was here that we saw some of the best overall irrigated yields. All of this led to good growing conditions for most of July. However, July also saw our major ‘wind event’ which led to many ‘leaners’ which created problems for pollination and standability on corn for certain hybrids.
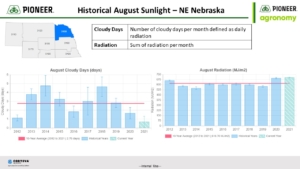 This chart shows the cloudy days and sunlight for August. Just like in June and July, August saw a reduction in cloudy days and above normal sunlight compared to the prior ten years, even with the smoke advisories that were occurring in the first ten days of the month…we got lucky here compared to other areas of the state and country.
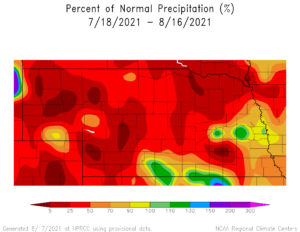
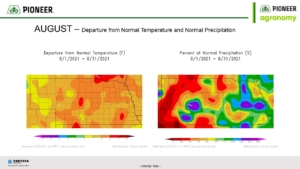 This chart shows the departure from normal temperature and normal precipitation for August. Note first the increase in temperatures for August. Temperatures, especially nighttime temperatures, were above normal for most of the month. This allowed for continued increase in GDU accumulation but led to increased stress on the plant and consequent heavy irrigation for August. However, mother nature gave us some relief as we see from the precipitation map. Much of our area of Antelope County was normal to above normal precipitation. Though we received it at the end of the month, this greatly helped our dryland corn and soybeans. This may explain our irrigated soybean yields, as soybeans like sunlight, (which we got enough of), and they received precipitation in August which ‘makes’ soybean yield. August also saw another ‘wind event’ on the last Saturday of the month which caused more ‘leaners’ and some broken plants in the area.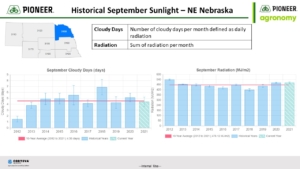
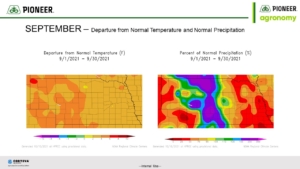 This chart shows the departure from normal temperature and precipitation for September. Note the increase in overall temperatures for September and the dry conditions that returned after the rainfall in August. This does beg the question; did we stop irrigation too soon on some fields? September turned off hot and dry and I do think, on some fields and some hybrids, we left a few bushels on the table by not giving it ‘one last round’……
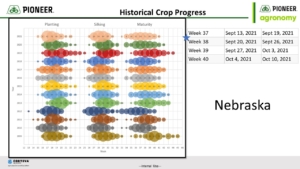 Here’s the chart showing crop progress for the whole year for Nebraska. Main thing to note here is that the grain-fill period for 2021 was extended , but also occurred earlier than prior years. In 2021, plants tended to extend grain-fill period vs. noted GDU requirements for black layer, more so than other years. With good sunlight and warm temps, yields increased across the region. We have talked a lot in past years on the impact of adequate sunlight; the last two years have shown how much influence sunlight has on yield.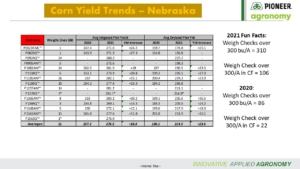
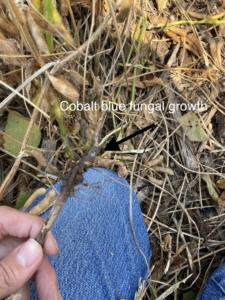 Not the best quality, but want to point out the cobalt blue fungal growth on the root system from SDS.