With harvest on the back half now, it’s time to send out an update on what trends we are seeing from this harvest, and what contributed to the yields we ‘are not’ seeing. Overall, average irrigated yields on corn are down across the general area (throughout much of Nebraska as well), for both heavy and sandy soils; however, the sand has seen a steep drop off from past few years. In fact, some sandy fields are seeing the poorest yield in 10-15+ years. This leads to the question of ‘why’? This update will try to provide a few answers to this question….
Quick Takeaways:
- Irrigated corn yields are down 3–30% from average.
- Sandier soils hit hardest — shallow rooting + N loss from July rains.
- Cloudy during grain fill + warm nights reduced test weight and kernel depth.
- Tar Spot + Southern Rust compounded late-season stress.
- Cooler, wet early September increased ear molds.
PERFECT STORM….
As mentioned in the title to this update, 2025 was a ‘perfect storm’ of stress events. Environment has the greatest impact on final yield. We can ‘do everything right’ to the best of our ability, but Mother Nature has final ‘say’ on how ‘what we do’ turns out. As in every year, there is no one single cause for the yields we are seeing this year; however, 2025 gave many different stress events, from beginning to the end of the year and each stress compounded the other as the year progressed, and these stresses went from one extreme to the other.
1) ….2025 Precipitation….from lack-of to excess…
As always, precipitation (both amounts and timing of) plays a big role in final yield. The three images below helps put into perspective the impact precipitation had on irrigated yields:
![]()
![]()
the first map shows total precipitation rank by climate district from April 1 to mid-May. For this time period, NE Nebraska was the 125 wettest out of 133 years….only 8 years in the last 133 years were drier than 2025 at planting. This led to loose seedbeds (saw tillage impact this to a greater degree than normal), poorer seed-to-soil contact which meant that we had to irrigate 5-7 times just to get the corn up and in even shape….crop was stressed from the beginning. The dryland corners showed up wetter than the irrigated circle during harvest because of this dry period causing uneven emergence and growth.
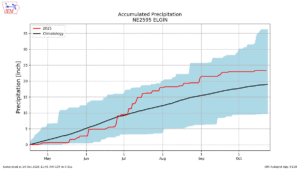
The second graph shows 2025 accumulated precipitation from April 17 to the present, with the red line showing 2025 and the black line showing the average. As in the first map, note just how dry we were up until later half of June, in fact, DESPARATELY dry….then starting the last week of June we saw 10-15+ (up to 20″ in localized spots) inches through to August 1st.
The third map shows just how wet July was with NE Nebraska climate district showing the wettest July in last 133 years, or since records began. This increased N-loss from leaching on the sands, impacted timing of N applications, and led to reduced root depth and volume…all of which led to shorter plant height in the lighter sand. We can see this from the graphs below:
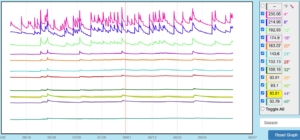
This first graph is a line graph showing each individual sensor from an AquaSpy soil moisture probe in sand. Note the movement of water by the crop on the 4″, 8″, and 12″ sensors, with just slight movement on the 16″ sensor and maybe a tick of movement at 20″. There is no discernible movement from the 24″ sensor on down throughout the growing season. By looking at this graph, it appears that the corn plant was only pulling from 20″ and above, or at the one-to-one-and-a-half foot depth all season. This means that the majority of the sandy fields were pulling water, nutrients, etc., from only half the soil volume as compared to the past few years…while at the same time living in an anerobic (no oxygen) environment (which impacts overall soil productivity) through all of July. In other words at peak energy time for the plant (ie. pollination). Couple this with a normally lower pH & lower fertility on very coarse sand, and the plant was not setup to deliver high yields….
Contrast this with a graph from heavy soils….
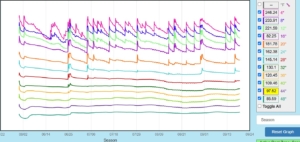
Note the movement all the way down to the 40″ sensor. However, even here, while movement reached normal depth, there was plentiful moisture throughout the rootzone. Key thing is that soil depth and volume were more conducive for water, nutrient uptake in the heavy soils vs. sand. Just two extremes on moisture at different stage of corn growth….both a negative to intensive, irrigated corn production. ‘Rain makes grain’ is a true statement, but mostly for the true dryland acre.
Field drainage (one of the top five in yield factors) was a big factor in overall yield. Some of the lower bottoms saw poorer yields versus higher ground from being over-saturated for so long, plus the lower ground would’ve had a longer period of leaf wetness vs. higher ground leading to heavier leaf disease. In a year like this year, even one extra hour per day was significant if it happened over 30-45 days in a row….
2)….Grainfill….Reduced Sunlight and Higher Nighttime Temperatures….
Sunlight….is what fuels the engine of the plant and is a critical component of both yield and plant health.
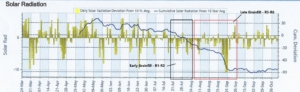
The above graph is solar radiation for the 2025 growing season for Elgin, NE. Note the two highlighted boxes showing sunlight during grainfill. From the beginning of pollination around the middle of July to mid-September, sunlight trended below normal (many smoky days here as well), with a steep drop off heading into the late half of grainfill. While we had good kernel counts to start grainfill, the engine was only getting half the fuel it needed, when it needed it the most….now, contrast this with 2024 sunlight:
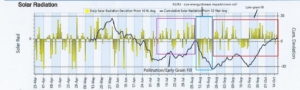
Much better sunlight from pollination throughout the grainfill period. There was a dip in mid-August, but September turned sunny and hot and the crop finished well with high test weights, very good kernel depth and excellent late-season health. This was not the case for 2025. As was mentioned earlier this year as harvest was starting, test weights and kernel depth were going to be off compared to last year, due in part to reduced sunlight.
Higher nighttime temperatures….nighttime temperatures affect yield due to respiration of the plant. At night, the plant respires (‘burns’) energy during hours with no sunlight. Higher nighttime temperatures lead to higher energy consumption by the plant during nighttime hours, couple this with reduced energy production from lack of sunlight during the daytime hours, and the plant is setting itself up for lower yields through lighter test weights and smaller kernel depth….at minimum poorer late-season plant health. See map below:
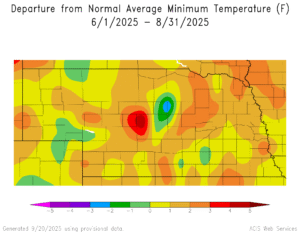
This map shows departure from normal average minimum temperatures for June-July-August 2025. Antelope county was 2-3 degrees above average through this period. While this has minimal impact in sunny weather, it is a negative to yield in reduced sunlight and when it occurs over a longer time period, especially during grainfill. It’s been said that every night that has a temperature that stays 70 degrees or above is a 1% reduction in yield….not sure we fully buy this, maybe .3-.4%….regardless of what it is exactly, there is a cost to higher nighttime temps. I discount this loss if we have normal to above-normal sunlight. However, we think it does show up in years where sunlight is reduced. We had 8 days with lows over 70 degrees in 2025.
Bottomline….higher nighttime temperatures have to be offset by good sunlight during the day….something we did not have this year. As grainfill was beginning there was already a governor starting to be applied on the plant’s engine….
3) Disease…and more disease….and more disease….
The 2025 growing season saw the highest severity of leaf disease in our many years of experience from Southern Rust and Tar Spot. Disease, by itself, was not the sole cause of lower yields, but it played a very big role in overall final yield. For the second year in a row (which has not been experienced before) infestation of Southern Rust was very high. Weather patterns of good southerly flow out of the gulf all summer and fronts (moisture) moving through from the NW, in my opinion, created conditions for severe Southern Rust outbreaks. Temperatures and humidity allowed for rapid and continual development of this disease throughout the growing season. Tar Spot infestations also showed up earlier and heavier than in 2024, with rapid development of this disease from end-of-August through September. In many ways, Tar Spot was like someone with an already weakened immunity system contracting Covid and then Covid killing them…same for the corn plant, it was already weakened from other stresses during the year and Tar Spot was the final event that ‘pushed it’ over the edge. Fungicide paid huge dividends for yield this year (like last year) and two treatments increased yields in most cases as well.
A comment on disease and sunlight and plant health. In many fields last year, Southern Rust was just as heavy as this year (though Tar Spot was not) and yet, overall irrigated yields were much above normal. This shows the impact sunlight, temperatures, and humidity play in the development and impact of disease from year-to-year. Some sand fields this year saw much poorer yields with a fungicide application in 2025 versus yields in 2024 with no fungicide application. Those fields in 2025 that got off to a clean start and fast growth (in other words, were healthy from the beginning) were able to ‘fight off’ the disease better when it came, maintaining yield close to 2024. Again, disease was a HUGE factor in final yield in 2025, but not the sole factor. Genetic tolerance also played a role….across hybrids and companies….
4) GDU Accumulation….Ear Molds….
The chart below shows GDU accumulation for the 2025. As mentioned in our updates from this past growing season, GDU accumulation was trending above average in April and through the first half of May, but then we cooled down and stayed slightly above average through July and but then increased in August. Most of the reason for being above normal GDU accumulation was due to the warmer nighttime temperatures mentioned above….which was a negative to yield.
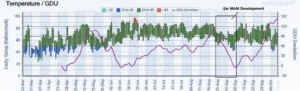
Now note the black box at end of August into first part of September. Note the lack of GDU accumulation, the cold temps in early September and this is also the time we received higher rainfall around Labor Day. All of this contributed to increased development of ear molds. Ear molds were common in most all fields, regardless of planting date, etc. The amount of ear mold development is also a product of husk architecture and grain quality (as well as tip feeding from insects), so there can be differences in ear mold severity between hybrids. Since we were not seeing the same test weights or kernel depth as past years, this led to increased ear mold development under the cooler, wetter conditions. This increase in ear molds further reduced test weights and kernel depth, even though kernel counts were good. If we would’ve had the weather we experienced at the end of September this year, at the beginning of September, ear molds would have been almost non-existent.
| 2025 Yield Impact Summary | |||
| Factor | 2025 Trend / Condition | Impact on Yield & Crop Health | |
| Spring Moisture | Extremely dry at planting (top 10 driest in 133 years) | Uneven emergence, poor seed-to-soil contact, shallow early roots, early nodal root development impacted. | |
| July Rainfall | Record wettest July on record (10–20” rainfall in spots) | N leaching, saturated soils, reduced root depth and oxygen, uneven plant height | |
| Sunlight | Below normal from pollination through grainfill | Reduced kernel depth and test weight, slower sugar conversion | |
| Nighttime Temps | 2–3°F above normal; 8+ nights >70°F | Increased respiration losses, lower energy efficiency, potential 6–10% yield drag | |
| Disease Pressure | Severe Southern Rust & Tar Spot (2nd year in a row) | Early leaf death, reduced grainfill duration, higher benefit from fungicide | |
| GDU Pattern | Warm early, then cool and wet in early September | Increased ear mold risk, delayed drydown, reduced kernel quality | |
| Soil Type Impact | Sands hit hardest; heavy soils fared better | Sandy fields showed shallow rooting and poorest yields in 10–15 years | |
Bottomline….
Each growing season we see these stresses show up, however, we usually don’t see all of these show up in the same year and to such extremes…or, we have something that offsets the stress….like extra sunlight, lower humidity, etc.
Other factors such as breakdowns of equipment, timing of fertilizer and chemical applications…anything that delayed or interfered with timely management….became more exaggerated as the year progressed.
The most true statement heading into 2026 is that no two years are alike weather wise….July 2026 will not be the July of 2025….
Please contact with any questions or comments you are seeing as harvest continues. Thank you for your business and support!!
Have a continued safe and successful harvest!
Starman Seed & Supply, Inc.