Fun fact: A single tassel produces approximately 5+ million pollen grains….
Topics:
– Growing Degree Day Update/Forecast Maps
– Corn Plant Height…no two years alike
– What’s going on in my fields?…..Corn Development, etc.
– Fungicide/Disease in Corn
– Insect Update
– Soybean Development
As of July 12th, we have accumulated approximately the following for Growing Degree Days in 2022:
TEMPERATURES & GDU ACCUMULATION:
As of June 17, we have accumulated approximately the following for Growing Degree Units in 2022:
Planting Date GDD’s2022 Average GDD Departure from average
April 21 1401 1328 + 73 (+ 3 days)
April 28 1335 1277 +108 (+4 days)
May 9 1272 1187 +85 (+ 3 days)
Current GDD numbers are running 3-4 days ahead of normal across all planting dates. We have picked up some ground from the warm temperatures over the past month.
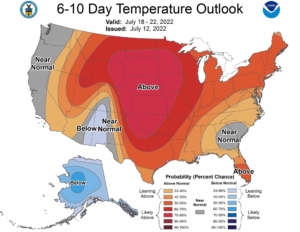
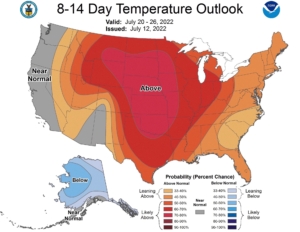
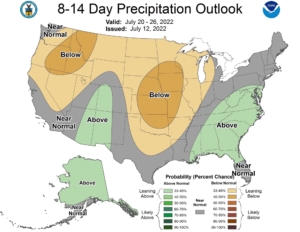
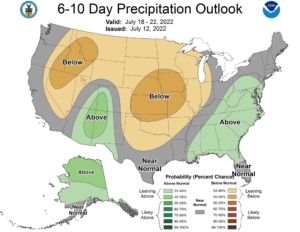
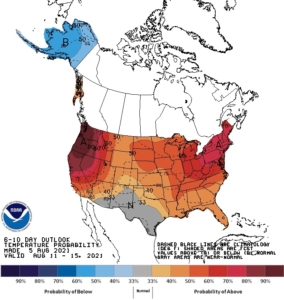
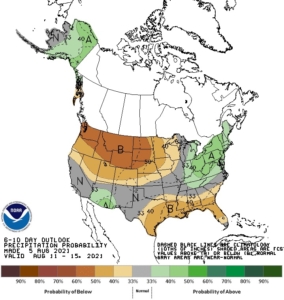
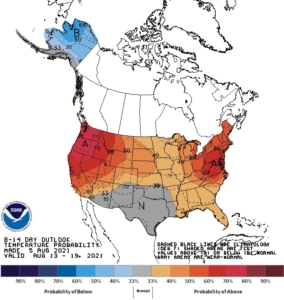
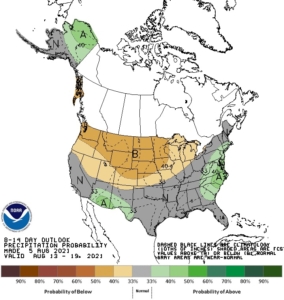
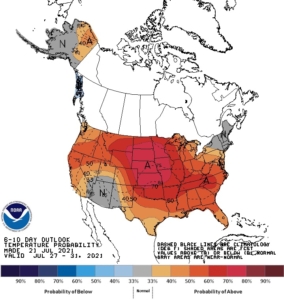
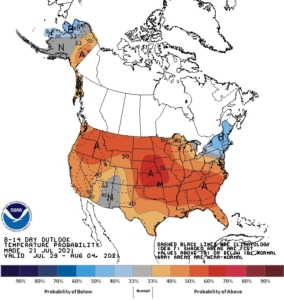
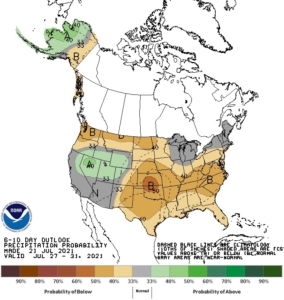
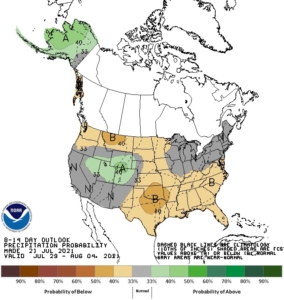
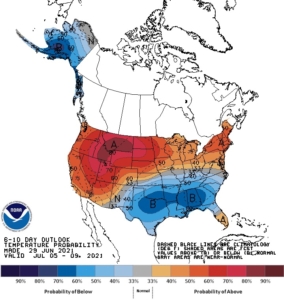
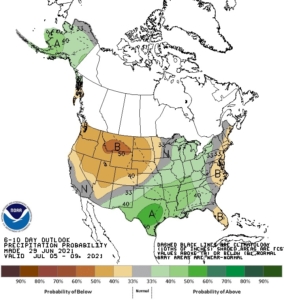
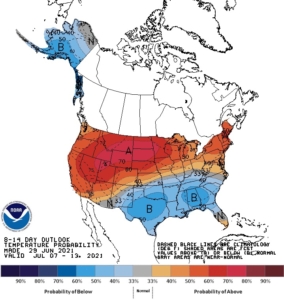
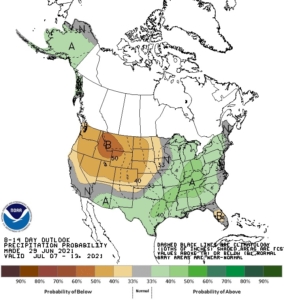
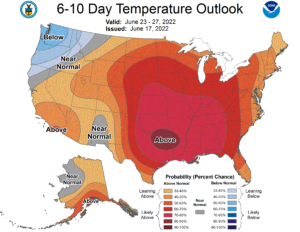
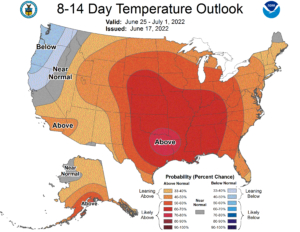
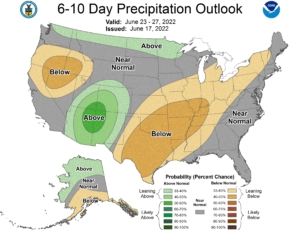
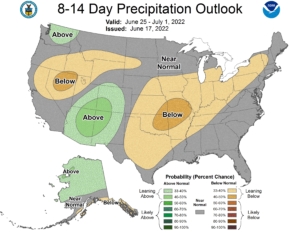
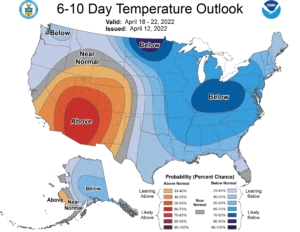
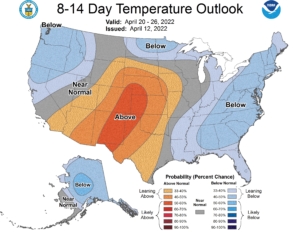
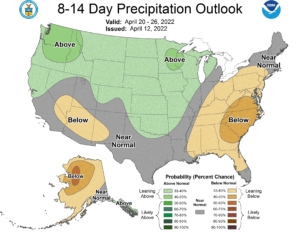
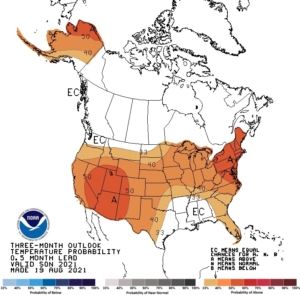
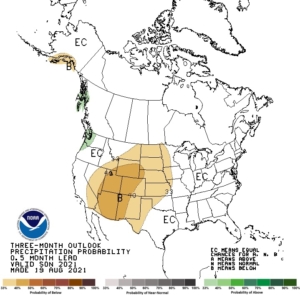
The above maps are the 6-10 & 8-14 day temperature and precipitation outlooks issued July 12th. The hot, dry weather will continue the current GDD trend.
Based on the above numbers, when can we expect to silk? If we look at P1366 genetics we see that it takes approx. 1380 GDU’s to silk, this means that we would should approximately be silking on this hybrid on any April planting dates and 3-4 days yet on May dates. Hybrids such as P0622 (1270 GDU’s to silk) are starting to tassel. In other words, we can expect to see most all April planted fields begin tasseling this week, with heavy pollination shed occurring mid-next week into the following week….May dates the following week How the crop emerged this spring will play a role in tassel timing. However, we are tasseling about 3-4 days ahead of what we thought we would a month ago.
Corn Plant Height…no two years alike…
To quote some information from Bob Nielsen from Purdue and Tom Hoegemeyer from UNL.
The mature corn plant height depends on three factors:
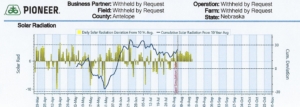
- Amount of solar radiation on the top leaves during growth
- Water
- Temperature
We usually don’t have issues with solar radiation in Nebraska. This year water was more of a factor. Much of the young corn plant’s development was in drier than normal growing conditions. There was adequate moisture for growth but nothing like we have experienced in recent years….in fact, we are currently 6+ inches below normal for the year, even counting the nice rains we received last week.
Water availability and temperature impact growth rate. Cell division is affected much less than cell expansion, and slower growth rates lead to slower root development, further limiting water uptake and nutrients. Slower cell expansion leads to shorter internodes and smaller leaves, and this leads to less water uptake and light interception, CO2 uptake, further impacting growth. Because of these changes, we have less internode elongation and thus early planted corn tends to be shorter than later planted corn. June temperatures were also the exact opposite between 2021 and 2022. First half of June was above normal temperatures in 2021 with normal temps after that. In 2022, the first half of June was normal temperatures and the second half above normal temps…the same period we had reduced rainfall and had to rely on irrigation….
Will conditions leading to shorter corn impact yield? Not necessarily. More important to the final yield of this year’s crop is the heat and moisture stress that the crop is now experiencing as it moves into pollination. With high heat forecast for the coming week, this could be a concern in reduced water areas.
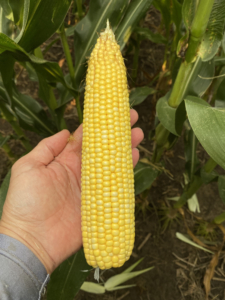
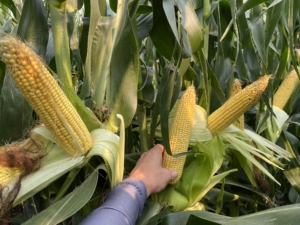
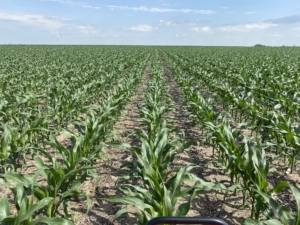
What’s going on in my field?….
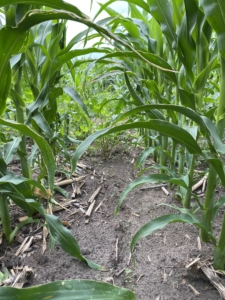
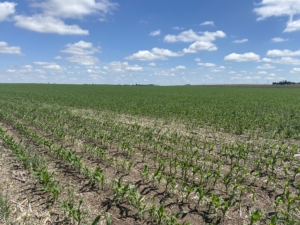
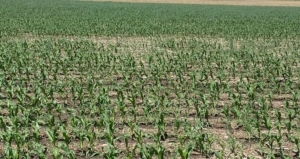
- Overall much of the corn crop looks good! The unevenness from the residue remains, but is now somewhat hidden. Much of the corn crop is in the V14-VT stage, with tassels beginning to poke out along tree lines, etc., depending upon hybrid and planting date. This is slightly ahead of last year. From V10-VT, corn gains a new color every 50 GDU’s, or about every other day.
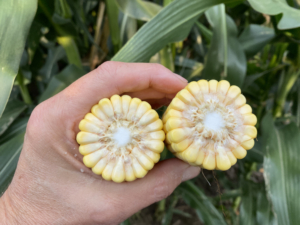
- Kernels per row began around V12 and is continuing through and up to tassel stage
- Nitrogen needs will continue to grow through tasseling and into early reproductive stages. Nitrogen uptake in corn – very rapid now through tassel (up to 4-8 lbs per day). Today’s hybrids use nitrogen later in the growing season and into the reproductive phases. You will want to keep that last shot of N available for after tasseling….40-50# This year so far, we haven’t experienced conditions that usually lead to N loss from leaching or denitrification….overall color looks good! The warm temps should see more N potentially available in the soil profile through mineralization.
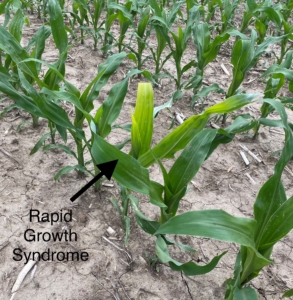
- We are now into the rapid growth and accumulation of dry matter by the plant. The window for brittle snap is still open over the next 7-10 days.
- Under field conditions, pollen shed usually occurs in the late morning and early evenings.
- Pollen shed will extend for one to two weeks, but if field is uniform in plant emergence and height, pollen shed is 80% complete in 5-7 days from full tassel emergence.
- At tassel, vegetative development is now complete; maximum plant height and root depth is achieved.
- VT overlaps with R1 (silking stage) when visible silks appear before the tassel is fully emerged. By definition, growth stage R1 (Abendroth et al., 2011) for an individual ear is defined when a single silk strand is visible from the tip of the husk. An entire field is defined as being at growth stage R1 when silks are visible on at least 50 % of the plants. This whole field definition for growth stage R1 is synonymous with the term “mid-silk”.
- A captured pollen grain takes about 24 hours to grow down the silk to the ovule for fertilization.
- Peak pollen shed usually occurs in mid-morning. Some research indicates that pollen shed decreases after temperatures surpass 86F. A second “flush” of pollen often occurs in late afternoon or evening as temperatures cool. Pollen shed may occur throughout most of the day under relatively cool, cloudy conditions….. Crop Focus – Corn Pollination Success
- Weather conditions influence pollen shed. If the anthers are wet, the pores will not open and pollen will not be released. Thus, on an average summer morning following a heavy evening dew, pollen shed will not begin until the dew dries and the anther pores open. Similarly, pollen is not shed during rainy conditions. Cool, humid temperatures delay pollen shed, while hot, dry conditions hasten pollen shed.
- Generally 2-3 days are required for all silks on a single ear to be exposed and pollinated, with the silks on the butt of the ear emerging first. The silks will grow from 1-1.5 inches each day and will continue to elongate until fertilized. If not pollinated, silk elongation stops about 10 days after silk emergence due to senescence of the silk tissue. Unusually long silks can be a diagnostic symptom that the ear was not successfully pollinated.
- Silk emergence and growth is dependent upon turgid pressure within the plant, in other words how much water is available in the plant to cover all of its needs. If this is limited, (ie. dryland, low-gallon wells, etc.) silk emergence will be slowed and delayed with potential to miss the pollen shed. Under severe water stress conditions pollen shed will still take place like normal, however, silks can be delayed, which means potential for poor pollination.
- It takes approximately 55-60 days from silking to physiological maturity. So if a field is silking on July 15th, it will need until September 15th to reach maturity, given average weather. Current 6-10 and 8-14 day forecasts call for above normal temperatures, which should give us a GDD accumulation of 27-30 GDU’s per day.
- High nighttime temperatures (ie. any stress) begin to play a role in final yield during grain-fill as this causes the plant to work harder to maintain both yield and overall plant health, thereby lowering potential final yield.
Corn Leaf Disease/Fungicide
- The next four to six weeks will be critical for disease infestations and fungicide applications.
- Begin scouting now and through the next few weeks for disease infestations. So far, leaf disease load in area cornfields is very low, mainly bacterial leaf streak and a few GLS lesions. We are not seeing any Tar Spot in the area. If it shows up, it will be much later in the season and at low incidence as this disease has to move in from the east.
- If you are planning on only one fungicide application, the best timing for this application is after pollination as the crop is working the hardest and has the highest demand for energy at this time. We want to protect as much of the leaf surface as possible in this time frame, which is from pollination and the two weeks after. Corn on corn acres are always a good place to start with fungicide applications.
- While any hybrid can have a response to foliar fungicides, hybrids such as P0622, P0924, P0950, P0908, P0995, P1185, P1366 & P1563 are hybrids to focus on first for higher probability of response from foliar fungicides, especially if gray leaf spot infestations are high…..2022 Pioneer Corn Fungicide Response Considerations ….This attachment is a list of Pioneer hybrids and their potential response to a fungicide application for Gray Leaf Spot and Norther Corn Leaf Blight. The chart also shows staygreen and stalk strength ratings for each hybrid. This chart can help with fungicide management decisions.
- See attachments on disease and fungicide management – Maximizing Foliar Fungicide in Corn and Bacterial Leaf Streak
- Fungicide Efficacy for Control of Corn Diseases. This attachment shows efficacy by active ingredient for different leaf diseases, for the current fungicides on the market.
Water Management
Below are some key water management tips to keep in mind:
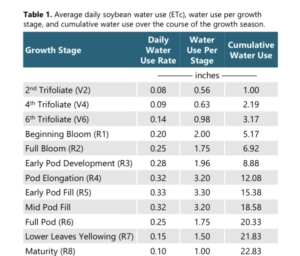
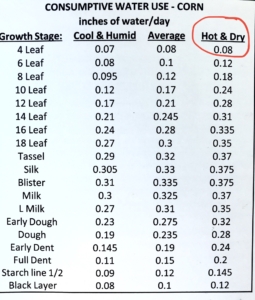
- The greatest yield loss from moisture stress occurs in the period two weeks prior to two weeks after pollination. For the next two weeks, the corn crop will be at its peak water usage, with ET rates of .30+ inches per day – higher when temps are in the mid-90’s and higher yet when combined low humidity….the hot, windy days we experienced recently saw .45-.50 ET rates/day!
- ET rates over the past two weeks have been above normal. Normal daily ET rates for the past two weeks is .28/day…we have averaged .36/day in 2022….30% higher than average…no wonder it was difficult to keep up on sands! Thankfully we have received some timely rainfall in this period. However, we are now fast approaching peak water use in corn, and with the potential higher temps forecasted for the next couple of weeks, it will be important to stay on top of overall water needs by the crop.
- At present, we are seeing fairly good root depth according to the soil moisture probes….sandier soils are 16-28” (better than average) and heavy soils are 24-40+” (average) depending upon plant date, conditions and soil type. Remember that maximum plant height and root depth are achieved once the plant tassels.
Insect Update
Western Bean Cutworm egg masses can be found in area, sandy fields. Keep these tips in mind over the next few weeks:
- To scout for this insect, check the sandier fields first and look on the upper side of the leaf for a white, or purple, egg mass. These will be found on the upper 1/3 of the plant.
- We will again have the pheromone moth traps located west of Elgin. Current numbers are trending higher than last year at this time. Check back on this website, under Grower resources, for updated moth flight counts.
- Treat when the fields are 95% tasseled. Use high rates of a Capture-like product to give you 3-4 weeks of residual control.
- WBC are attracted to those fields that are closest to tasseling.
- Once a field has been tasseled, any egg masses that hatch will see the larvae head straight to the ear tip, so treatment soon after tasseling is critical.
- AML versions of Pioneer hybrids offer control of WBC/Corn earworm. No need to treat these hybrids for WBC – these include P0622AML, P0908AML, P1366AML, P1563AML, & P2042AML.
Corn Rootworm
Adult beetle emergence is occurring right now, and will continue over the next few weeks. Monitor your continuous corn acres for adult beetle populations to:
- prevent high numbers interfering with pollination through silk-clipping. There is a higher potential for this to occur this year than past years due to timing emergence of the adults and potential for high overall numbers of beetles. The uneven plant emergence and slower growth in the residue areas means the adults will have an extended period for silk-clipping.
- help with rootworm control in your continuous corn acres. Strongly recommended to use Steward insecticide (by FMC) for control of adult beetle populations to help with next year’s control of rootworm. This product has shown excellent results for both kill and residual, upwards of 30 days.
Grasshoppers….seeing light feeding in both corn and soybeans from small grasshoppers. Keep monitoring for this insect if conditions stay dry.
Soybean Development
- Most of the soybeans in our area are at late-R1 (Beg flower) to late-R2 (Full flower). I would not be surprised to see early R3 (pod set) on some fields next week. Most fields are finally coming around and growing, but like the corn, some 30″ row, sand fields may not fully canopy….some fields are still showing leaf cupping…..crop growth is also uneven in some fields in those areas with high crop residue….much like many corn fields.
- Soybeans should be nodulating heavily at this stage. At the beginning of the reproductive stage, soybeans will still put on 50% of their vegetative growth.
- Crop water use in soybeans starts to increase rapidly at full flower, peaks at R3 and will stay high through R6, or full seed Flower stage is usually the time when the soybean plant begins to pull from the deeper root zones….we can see this happening on the soil moisture probes in the area.
- We continue to see a yield response from a fungicide application in soybeans, either at R1 for white mold (applications of which should be on already) and/or a later R3 (pod set) stage of growth. Environmental conditions over the next two months will determine disease incidence and overall level of disease infestation. Just a reminder, keep an eye out for Frogeye Leaf Spot in soybeans as not all fungicides control this disease. This disease is normally not an issue in our area and many varieties have very good tolerance to this disease. See attachment for more info on this disease….Frogeye Leaf Spot in Soybeans
- White mold attachment: Managing White Mold in Soybeans
Thank you for your business!! Please let us know any questions or concerns you may have!!
Starman Seed Service, Inc.
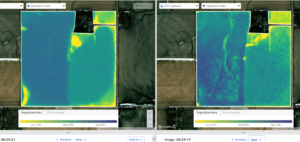
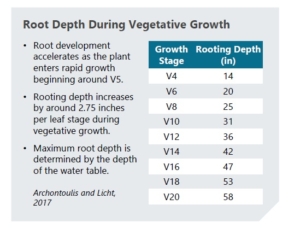 From the chart, you can see that average rooting depth for V6-V8 corn is approximately 20-25″, depending upon weather conditions, soil type and structure, etc. The AquaSpy moisture probes are showing 12-24″ rooting depths across soil types and planting dates, so we are very much in the normal on rooting depth. The video below presents where we are at on depth and crop water use.
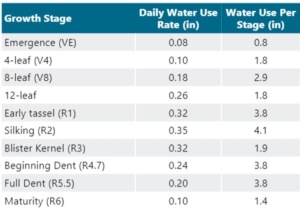
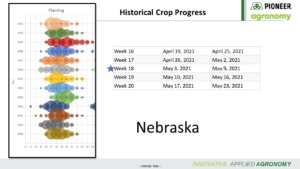 This is a chart showing the corn crop planting progress by years. The main thing to note here is the large circle at week 17 & 18. By week 18, over 70% of the corn crop was planted across the state, with more like 80% in our area. Last time we find that much corn planted that early was in 2021/2011 crop years. Having corn planted by the first week of May has proven to increase yields…did the early planting this year impact corn yields? Maybe so…. especially when we look at the rest of the growing season.
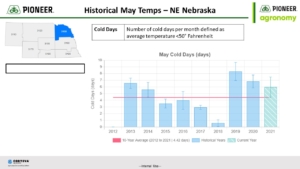 The above chart shows the number of cold days in May for NE Nebraska for the past ten years. Note that 2021 was above average for the number of days with average temperature below 50 degrees.
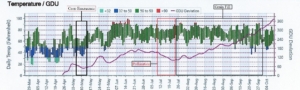
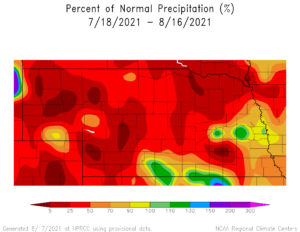
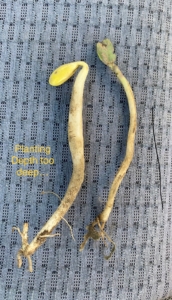
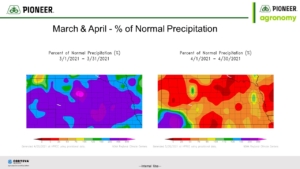 The above charts show the percentage of normal precip for March and April of this year. First note the abundant precip received in March; this was huge for dryland and limited irrigation fields. Second, not how dry April was overall. These conditions led to more ‘air pockets’ in some of the fields with less than optimum seed-to-soil contact leading to some uneven emergence. I also remember growers saying ‘how hard’ the soil conditions were at planting, especially when planting into May. May continued this downward trend of less than normal precipitation as we received only 60% of normal for May.
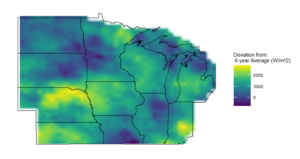
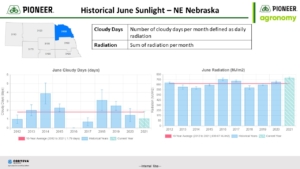 The above chart shows Cloudy Days and Sunlight for June. Two things to note here are the low number of cloudy days and the above average sunlight – in fact, the best sunlight for June in the past 10 years.
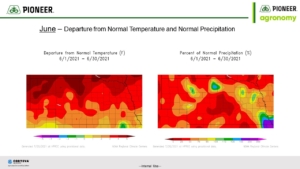 This chart shows the departure from normal temperature and normal precipitation for June. Note the above temps and slightly below normal precip for June. This, along with the above normal sunlight, led to optimal growing conditions, plants ‘stretched out’ with consequent higher ear placement. This was not the case for those fields planted in June itself. In these cases, plant height and ear height were below normal. This is where we began to run 7-10 days ahead of normal for GDU accumulation.
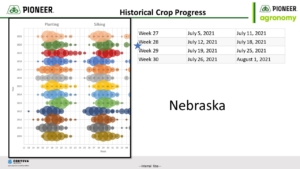 This chart shows the corn crop silking progress for Nebraska. Much like at planting, our silking dates were ‘bunched’ together, however, the crop silked later than expectations considering the heat in June…silking was more like normal time frame. However, there was some advantage I feel for those hybrids that silked early as they were not as impacted by the wind events, and they were better able to take advantage of the grain-fill weather.
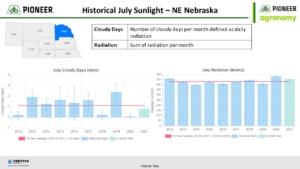 The above chart shows the cloudy days and sunlight for July. Just like in June, note the low number of cloudy days and slightly above normal sunlight, all conducive to yield….
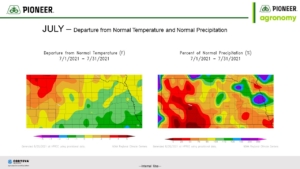 This chart shows the departure from normal temperature and normal precipitation for July. First thing to note is the slight reduction in temperatures for July. This led to a reduction in stress on the plant as well as delaying silking dates. Second, note the increase in precipitation in most of Antelope County…it was here that we saw some of the best overall irrigated yields. All of this led to good growing conditions for most of July. However, July also saw our major ‘wind event’ which led to many ‘leaners’ which created problems for pollination and standability on corn for certain hybrids.
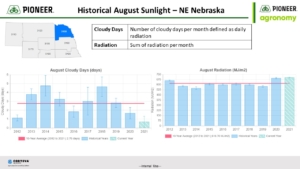 This chart shows the cloudy days and sunlight for August. Just like in June and July, August saw a reduction in cloudy days and above normal sunlight compared to the prior ten years, even with the smoke advisories that were occurring in the first ten days of the month…we got lucky here compared to other areas of the state and country.
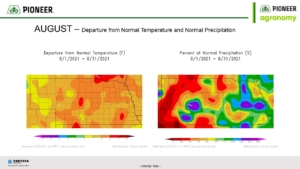 This chart shows the departure from normal temperature and normal precipitation for August. Note first the increase in temperatures for August. Temperatures, especially nighttime temperatures, were above normal for most of the month. This allowed for continued increase in GDU accumulation but led to increased stress on the plant and consequent heavy irrigation for August. However, mother nature gave us some relief as we see from the precipitation map. Much of our area of Antelope County was normal to above normal precipitation. Though we received it at the end of the month, this greatly helped our dryland corn and soybeans. This may explain our irrigated soybean yields, as soybeans like sunlight, (which we got enough of), and they received precipitation in August which ‘makes’ soybean yield. August also saw another ‘wind event’ on the last Saturday of the month which caused more ‘leaners’ and some broken plants in the area.
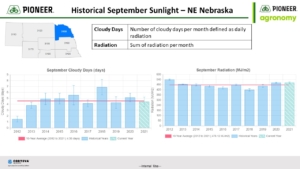
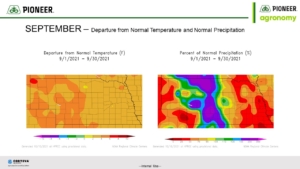 This chart shows the departure from normal temperature and precipitation for September. Note the increase in overall temperatures for September and the dry conditions that returned after the rainfall in August. This does beg the question; did we stop irrigation too soon on some fields? September turned off hot and dry and I do think, on some fields and some hybrids, we left a few bushels on the table by not giving it ‘one last round’……
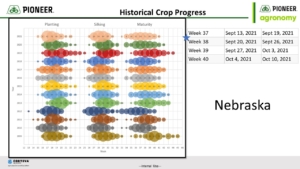 Here’s the chart showing crop progress for the whole year for Nebraska. Main thing to note here is that the grain-fill period for 2021 was extended , but also occurred earlier than prior years. In 2021, plants tended to extend grain-fill period vs. noted GDU requirements for black layer, more so than other years. With good sunlight and warm temps, yields increased across the region. We have talked a lot in past years on the impact of adequate sunlight; the last two years have shown how much influence sunlight has on yield.
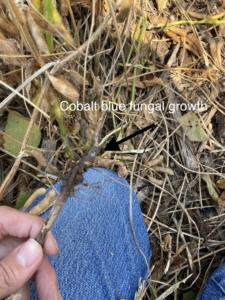 Not the best quality, but want to point out the cobalt blue fungal growth on the root system from SDS.
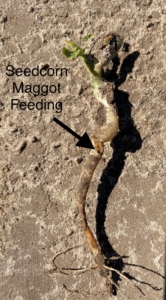
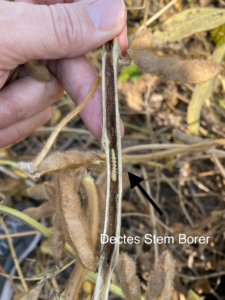 This insect enters the plant at a node and proceeds to ‘hollow out’ the stem leading to early plant death. So far not much one can do in the way of management for this insect yet.