November 11, 2021
2021 Harvest Newsletter
2021 has seen many ‘ups and downs’, however, one positive ‘up’ was excellent overall crop yields.
GROWING SEASON REVIEW: Let’s look at some of the factors that played a role in the overall yields we saw this year. We will look at some weather charts that will give us some idea of trends to look at in reviewing the 2021 growing season.
Early Season: April & May
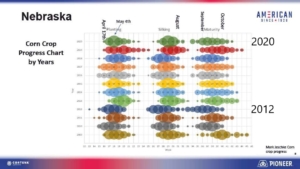
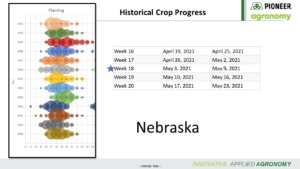 This is a chart showing the corn crop planting progress by years. The main thing to note here is the large circle at week 17 & 18. By week 18, over 70% of the corn crop was planted across the state, with more like 80% in our area. Last time we find that much corn planted that early was in 2021/2011 crop years. Having corn planted by the first week of May has proven to increase yields…did the early planting this year impact corn yields? Maybe so…. especially when we look at the rest of the growing season.
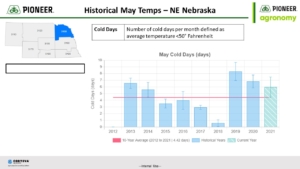 The above chart shows the number of cold days in May for NE Nebraska for the past ten years. Note that 2021 was above average for the number of days with average temperature below 50 degrees.
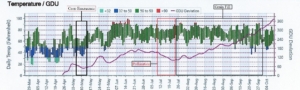
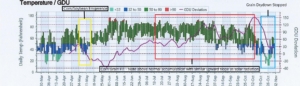
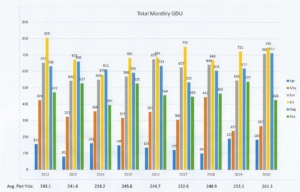
On this graph of GDU accumulation, note the black box in the first week of May. This is when we had most of the below 50 degree days in May. This week was when the April 27-30 planting dates were beginning to emerge. These cooler temps slowed down emergence on the no-till fields. The darker the soil, the more uniform and consistent the stands were. We saw this same thing in no-till soybean fields. Many no-till fields ‘sat’ for an extended period before really growing, which delayed their maturity.
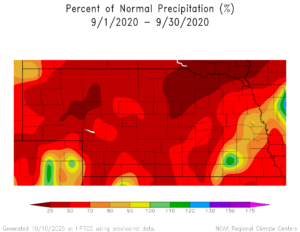
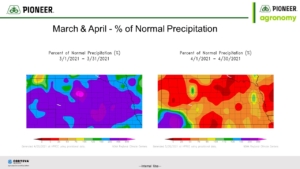 The above charts show the percentage of normal precip for March and April of this year. First note the abundant precip received in March; this was huge for dryland and limited irrigation fields. Second, not how dry April was overall. These conditions led to more ‘air pockets’ in some of the fields with less than optimum seed-to-soil contact leading to some uneven emergence. I also remember growers saying ‘how hard’ the soil conditions were at planting, especially when planting into May. May continued this downward trend of less than normal precipitation as we received only 60% of normal for May.
Mid-Season: June
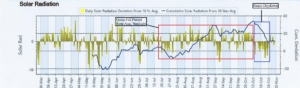
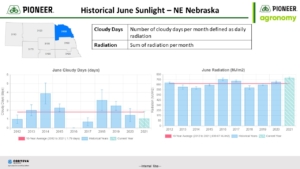 The above chart shows Cloudy Days and Sunlight for June. Two things to note here are the low number of cloudy days and the above average sunlight – in fact, the best sunlight for June in the past 10 years.
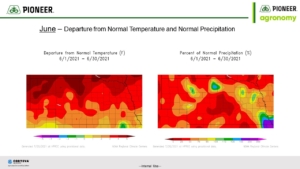 This chart shows the departure from normal temperature and normal precipitation for June. Note the above temps and slightly below normal precip for June. This, along with the above normal sunlight, led to optimal growing conditions, plants ‘stretched out’ with consequent higher ear placement. This was not the case for those fields planted in June itself. In these cases, plant height and ear height were below normal. This is where we began to run 7-10 days ahead of normal for GDU accumulation.
Mid-Season: July
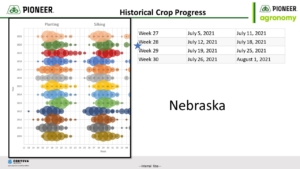 This chart shows the corn crop silking progress for Nebraska. Much like at planting, our silking dates were ‘bunched’ together, however, the crop silked later than expectations considering the heat in June…silking was more like normal time frame. However, there was some advantage I feel for those hybrids that silked early as they were not as impacted by the wind events, and they were better able to take advantage of the grain-fill weather.
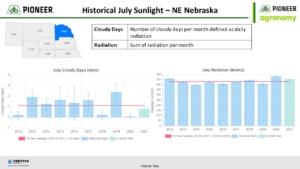 The above chart shows the cloudy days and sunlight for July. Just like in June, note the low number of cloudy days and slightly above normal sunlight, all conducive to yield….
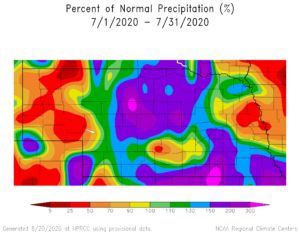
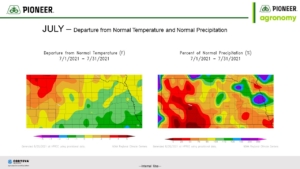 This chart shows the departure from normal temperature and normal precipitation for July. First thing to note is the slight reduction in temperatures for July. This led to a reduction in stress on the plant as well as delaying silking dates. Second, note the increase in precipitation in most of Antelope County…it was here that we saw some of the best overall irrigated yields. All of this led to good growing conditions for most of July. However, July also saw our major ‘wind event’ which led to many ‘leaners’ which created problems for pollination and standability on corn for certain hybrids.
Late-Season: August
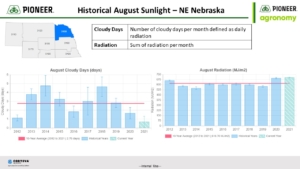 This chart shows the cloudy days and sunlight for August. Just like in June and July, August saw a reduction in cloudy days and above normal sunlight compared to the prior ten years, even with the smoke advisories that were occurring in the first ten days of the month…we got lucky here compared to other areas of the state and country.
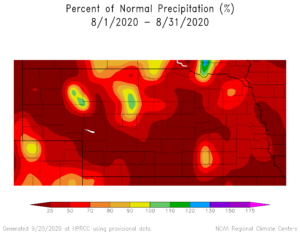
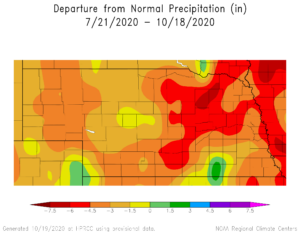
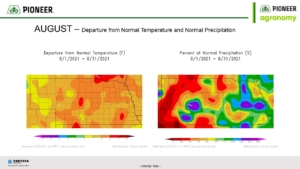 This chart shows the departure from normal temperature and normal precipitation for August. Note first the increase in temperatures for August. Temperatures, especially nighttime temperatures, were above normal for most of the month. This allowed for continued increase in GDU accumulation but led to increased stress on the plant and consequent heavy irrigation for August. However, mother nature gave us some relief as we see from the precipitation map. Much of our area of Antelope County was normal to above normal precipitation. Though we received it at the end of the month, this greatly helped our dryland corn and soybeans. This may explain our irrigated soybean yields, as soybeans like sunlight, (which we got enough of), and they received precipitation in August which ‘makes’ soybean yield. August also saw another ‘wind event’ on the last Saturday of the month which caused more ‘leaners’ and some broken plants in the area.
Late-Season: September
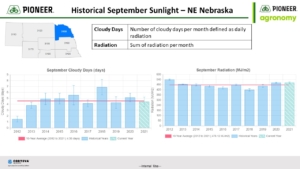
This chart shows the cloudy days and sunlight for September. Here we start to see an increase in cloudy days, especially in the first part of the month. However, sunlight hangs in there and is at least normal.
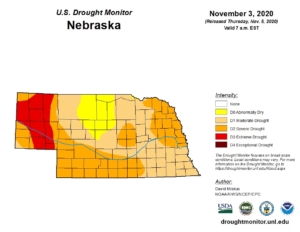
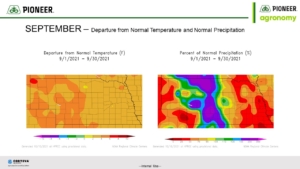 This chart shows the departure from normal temperature and precipitation for September. Note the increase in overall temperatures for September and the dry conditions that returned after the rainfall in August. This does beg the question; did we stop irrigation too soon on some fields? September turned off hot and dry and I do think, on some fields and some hybrids, we left a few bushels on the table by not giving it ‘one last round’……
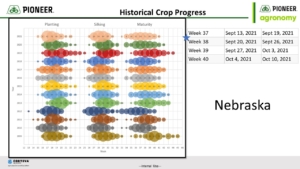 Here’s the chart showing crop progress for the whole year for Nebraska. Main thing to note here is that the grain-fill period for 2021 was extended , but also occurred earlier than prior years. In 2021, plants tended to extend grain-fill period vs. noted GDU requirements for black layer, more so than other years. With good sunlight and warm temps, yields increased across the region. We have talked a lot in past years on the impact of adequate sunlight; the last two years have shown how much influence sunlight has on yield.
CORN YIELDS: For the most part, irrigated corn yields were very good to tremendous and dryland yields were much better than anticipated considering the drought conditions, especially in the heavier soils. Overall grain quality is very good with above average test weights, all a reflection of the adequate sunlight.
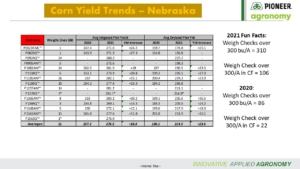
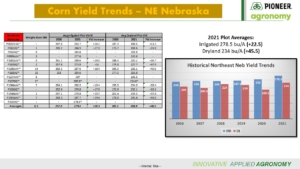
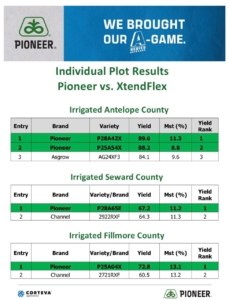
The above two charts give you some idea of the yield levels we saw this year. Note the number of 300 bu weighs! Also, note the increase in plot average yields for 2021 vs. 2020, both irrigated and dryland…. double digits!
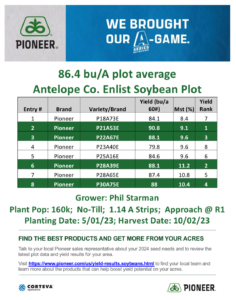
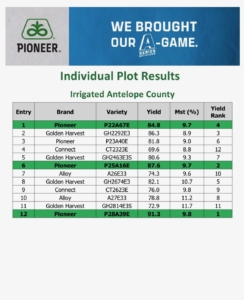
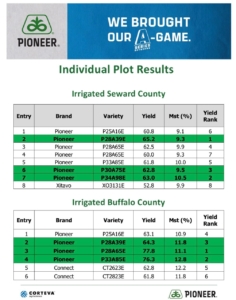
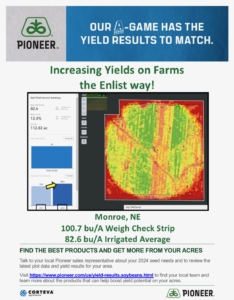
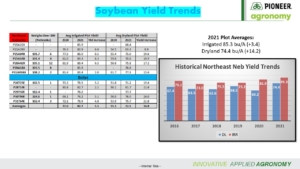
SOYBEAN YIELDS: As with corn, soybean yields, for the most part, were also very good to ‘best ever’. Many whole farm averages were in the mid-70’s to mid-80’s to over 90+ bu/acre. Dryland yields were also much better than expected.
PERFORMANCE: The corn lineup from Pioneer® again offered industry-leading performance in 2021. As you look through the yield data, you will see that 2021 saw strong performance across the maturity line from Pioneer®. In the early maturity area, there was strong performance from P0421, P0622 and P0950, with new product P0404. In the mid-maturity area watch for P1082, P1185, and P1108 families with new products P0924, P0908 & P0995. In the fuller maturity area, look for P1359, P1366, P1548 and P1563 families, with new products P1237 & P1278. Many of these hybrids have both AM and Qrome® versions.
2021 saw continued use of Leptra® hybrids from Pioneer. Optimum® Leptra® hybrids have a powerful pyramid of traits with three modes of action to provide superior control of above-ground pest, including corn borer, corn earworm and western bean cutworm. These hybrids will have the letters AML behind the hybrid number.
The 2021 lineup of Pioneer® brand A-series soybean varieties continued their industry-leading performance. The top performers for our area include P21A28X, P25A54X, P25A04X, and P28A42X. There are two new offerings for 2022, 20A22X and 28A51X. This lineup offers the best yield and agronomic/disease package we have seen yet from Pioneer. Pioneer® also has available the new Enlist E3® soybeans. Enlist E3® is the blend of 2,4-D and either glyphosate and/or Liberty. Varieties for this technology include P26T23E, P28T02E, and P29T37E. There will also be new A-Series Enlist E3® soybeans available in limited quantity for 2022.
2021: December 3rd is the first early order deadline and offers the best product and cash discounts along with TruChoice financing options. We will do all we can to offer you a package of products and services that will provide you with the best opportunity to achieve the most return from your operation in 2021.
We want to THANK YOU for your confidence in us and letting us be a part of your operation!! THANKS also for your continued support and to all who helped gather the data!
Stay safe and healthy!!
Starman Seed Service, Inc.
–‘Shout out’ to Kevin Kowalski, Pioneer Agronomist, for the sunlight weather charts and yield trend charts! Thanks Kevin!
2021 Plot Data
Irrigated Corn – Dual Column Report- Irrigated Corn
Dryland Corn – Dual Column Report – Dryland Corn
Soybeans – Dual Column Report – Soybeans