2020 Harvest Newsletter/Yield Data…..November 9, 2020….
November 9, 2020
2020 Harvest Newsletter
2020 has been a year of unprecedented outcomes and unknown; of the world seeming to turn upside down. However, one constant for the year has been Mother Nature; as usual, she played the final role in overall yield for the 2020 growing season.
GROWING SEASON REVIEW: Let’s look at some of the factors that played a role in the overall yields we saw this year. We will look at some weather charts that will give us some idea of trends to look at in reviewing the 2020 growing season.
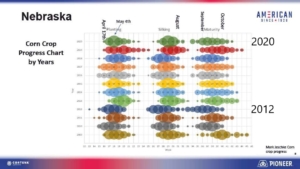
This is a chart showing the corn crop progress by years. Main thing to note is how bunched up the planting and silking dates were for 2020 and then how extended the grain fill period was even though planting/silking were very tight. In August it appeared that grain fill would be tight as well but that did not end up the case as will be shown below. Note also how 2012 and 2020 are very similar. The next chart show the Growing Degree Unit graph for 2020:
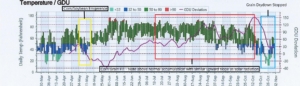
The green color indicates temperatures between 50 and 90 degrees, the blue color shows temperatures between 32 and 50, the light blue color shows below 32 and the red color is above 90 degrees. The purple line indicates how far above or below the GDU’s were for the year on any given date. I want to focus first on the yellow box. This box shows the cold temperatures that we experienced just as much of the corn/soybean crop was beginning emergence. This cold spell really delayed overall emergence and we saw some uneven emergence with some overall stand loss. In many cases it took fields 6-10 days from beginning emergence before final stands were complete. This is further revealed by the following Departure from Normal Temperature map for May:
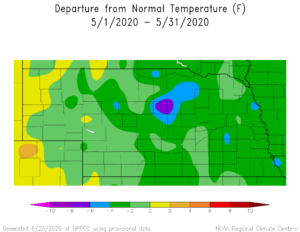
Note here that we averaged 3-4 degrees below normal for the month of May. However, this cold spell did not influence final yield as much as expected due to the following grain fill period, which is the red box on the upper chart. Note here the purple GDU deviation from normal line. Starting in early June, GDU accumulation began to be above normal and this trend continued right up to the end of the growing season in mid-October. Note also, that overall temperatures were not excessively hot during this time frame; we did not begin rapid GDU accumulation until mid-August with a corresponding slowdown in the first part of September, followed by increase in the last 10 days of September. This pattern limited the impact on crop stress due to high temperatures while extending the grain fill period. This slowed initial corn drydown, however. The end of the grain fill period saw a spike in the front part of October, which, if the field was watered well, gave a boost to yields right at the end, as well as giving a good ‘head start’ to grain drydown. But this also contributed to soybean grain moistures becoming too dry at the end of soybean harvest.
Now look at the blue box, which shows the cold/snow that came in the later half of October. This effectively stopped all grain drydown, and much of the crop sat at 17-20% until the first week of November. This next chart just shows a comparison between years for total monthly GDU’s from 2012 to 2020. Bottom of the chart shows average plot yields for those years.
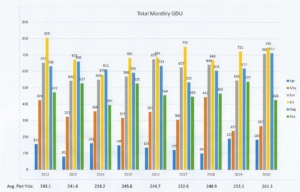
Note how close Jun-Aug accumulation was between months. Overall, GDU accumulation was conducive to good yields.
The next weather chart to look at will be solar radiation:
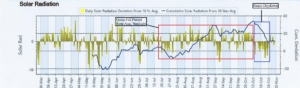
This chart shows the overall solar radiation for our area for 2020. The yellow bars show solar radiation daily deviation from the 10-year average. The blue line shows cumulative average from deviation as the growing season progressed. There are two boxes to pay attention in this picture. The red box shows solar radiation during grain fill. Note how many days were above the 10-year average. Note also, the sharp upward slope on the blue line starting in early August. This above average trend continued into September and early October. Here was the key component in our final corn and soybean yields. Sunlight is the energy source for the plant engine. Plants harvest the sun and convert that energy into grain yield. For both corn and soybeans, note the abundance of sunlight in August. Solar radiation for August was 17% higher than the 30-year average, which is the first year since 2012 in which that has happened. Soybeans love sunlight but aren’t to fond of high temperatures. We got a taste of what soybeans can yield in a high sun environment without excessive temperatures. This increase in sunlight also influenced final corn yields. If one could supply enough water and nutrients (here specifically thinking of N) then the corn crop was able to keep harvesting the sunlight leading to increased test weights and great grain quality. Overall solar radiation during grain fill was up 4% for 2020. This also was the first year above average since 2012. The blue box in the graph shows the lack of sunlight in the later part of October which came with the cold temperatures in that same time frame.
We now turn to precipitation, the other key component to final yields. The first set of maps we will look at will be Percent of Normal Precipitation for the months of Jul-Sep.
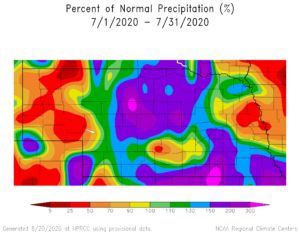
Here is the map for July. Note that Antelope county was 130-150% of normal precip for July. This was huge for final corn yields, especially dryland as this kept our soil moisture profile in good shape heading into grain fill and through early grain fill.
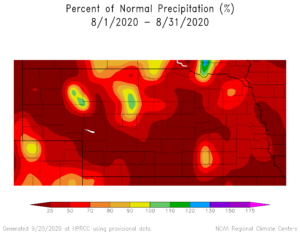
This map shows the month of August. August is where we turned off hot and dry. Note that August was 25-50% of normal precipitation. Keep in mind that normal precip for August is 4.5 inches. That means that irrigation needs were 3-4 inches above normal for August….one had to irrigate 3-4 circles more than in a normal year.
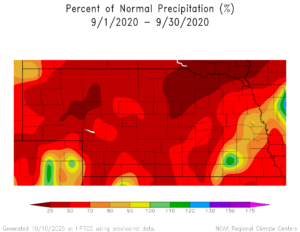
This trend continued into September which was also 25-50% of normal, increasing the deficit that was starting in August. Considering the extended grain fill period, a late watering really helped increase final yields as this helped the plant continue to harvest the sun.
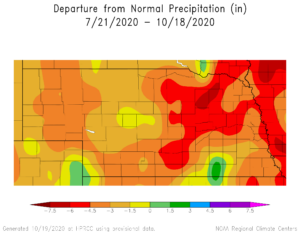
This map shows the Departure from Normal Precipitation for the grain fill period, from Jul 21 to Oct 18. Note the dark red band in southern Antelope County. We were below 6-8 inches below normal rainfall through this period. This equates to 7-10 extra circles above normal irrigation just to make up for this deficit. However, dry conditions usually means increased sunlight, which usually means very good irrigated yields…. if one can keep adequate soil moistures.
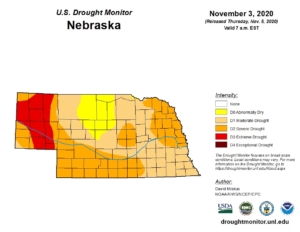
For reference, this map is the current drought monitor map for Nebraska. We are currently in a moderate drought with severe drought on our borders.
Along with the increased heat and sunlight, we saw lower overall relative humidity through the grain fill period. From mid-August thru mid-October, relative humidity was down an average of 15% from normal. This too, was the first year this happened since 2012. This led to an increase in ET rates up to a 10% increase at the end of August over normal ET usage. This low relative humidity reduced overall disease infestations in soybeans, as we saw minimal white mold and frogeye outbreaks. In corn, overall disease was also lower than normal; however, southern rust showed up in some fields later in the grain fill period, well after fungicide protection was gone. Initial yield data for 2020 still shows a 10-20+ bushel advantage for a fungicide application.
CORN YIELDS: For the most part, irrigated corn yields were very good to excellent and dryland yields were much better than anticipated, especially in the heavier soils. Overall grain quality is very good with above average test weights, all a reflection of the increased sunlight. Biggest harvest hiccup has been slower than anticipated drydown.
SOYBEAN YIELDS: As with corn, soybean yields for the most part, were very good to excellent to ‘best ever’. Many whole farm averages were in the mid-70’s to mid-80’s to over 90+ bu/acre. This is a direct result of the increased sunlight and overall drier conditions on irrigated, as we didn’t experience the saturated ‘wet’ bottoms like we have in the past few years. Dryland yields, while down from a year ago, were much better than expected.
PERFORMANCE: The corn lineup from Pioneer® again offered industry leading performance in 2020. As you look through the yield data, you will see that 2020 saw strong performance across the maturity line from Pioneer®. In the early maturity area, there was strong performance from P0421, P0622 and P0950. In the mid-maturity area watch for P1082, P1185(new), P1138 and P1108 families. In the fuller maturity area, look for P1359(new), P1366, P1415, P1548(new) and P1563 families. Many of these hybrids have both an AM and Qrome® versions.
2020 saw the first wide-spread use of Leptra® hybrids from Pioneer. Optimum® Leptra® hybrids have a powerful pyramid of traits with three modes of action to provide superior control of above-ground pest, including corn borer, corn earworm and western bean cutworm. These hybrids will have the letters AML behind the hybrid number.
The 2020 lineup of Pioneer® brand A-series soybean varieties continued their industry-leading performance. Now that Roundup Ready 2 Xtend® technology was re-registered, the full lineup of Xtend® soybeans from Pioneer are available. The top performers for our area include P21A28X, P25A54X, P25A04X, P27A30X and P28A42X. This lineup offers the best yield and agronomic/disease package we have seen from Pioneer. Pioneer® also has available the new Enlist E3® soybeans. Enlist E3® is the blend of 2,4-D and either glyphosate and/or Liberty. Hybrid’s for this technology include P22T18E, P26T23E, P26T57E, and P28T14E.
2020: December 3rd is the first early order dealine and offers the best product and cash discounts along with TruChoice financing options. Corteva Crop Protection incentives and Corteva Cash® will also be available for 2020.
We will do all we can to offer you a package of products and services that will provide you with the best opportunity to achieve the most return from your operation in 2020.
We want to THANK YOU for your confidence in us and letting us be a part of your operation!! THANKS also for your continued support and to all who helped gather the data!
Stay safe and healthy!!
Starman Seed Service, Inc.
2020 Yield Data files: Irrigated Corn – Dryland Corn – Soybeans
DualColumnReport_20201109075358.pdf